Getting Started with MicroProfile Metrics and Prometheus
In this article we will learn how to use MicroProfile Metrics and Prometheus to collect metrics from monitored targets.
Tools You Will Need
Maven 3.3+
Your favorite IDE
JDK 1.8
WildFly Swarm Project Generator
Go to http://wildfly-swarm.io/generator/ and follow the steps below to generate a new project.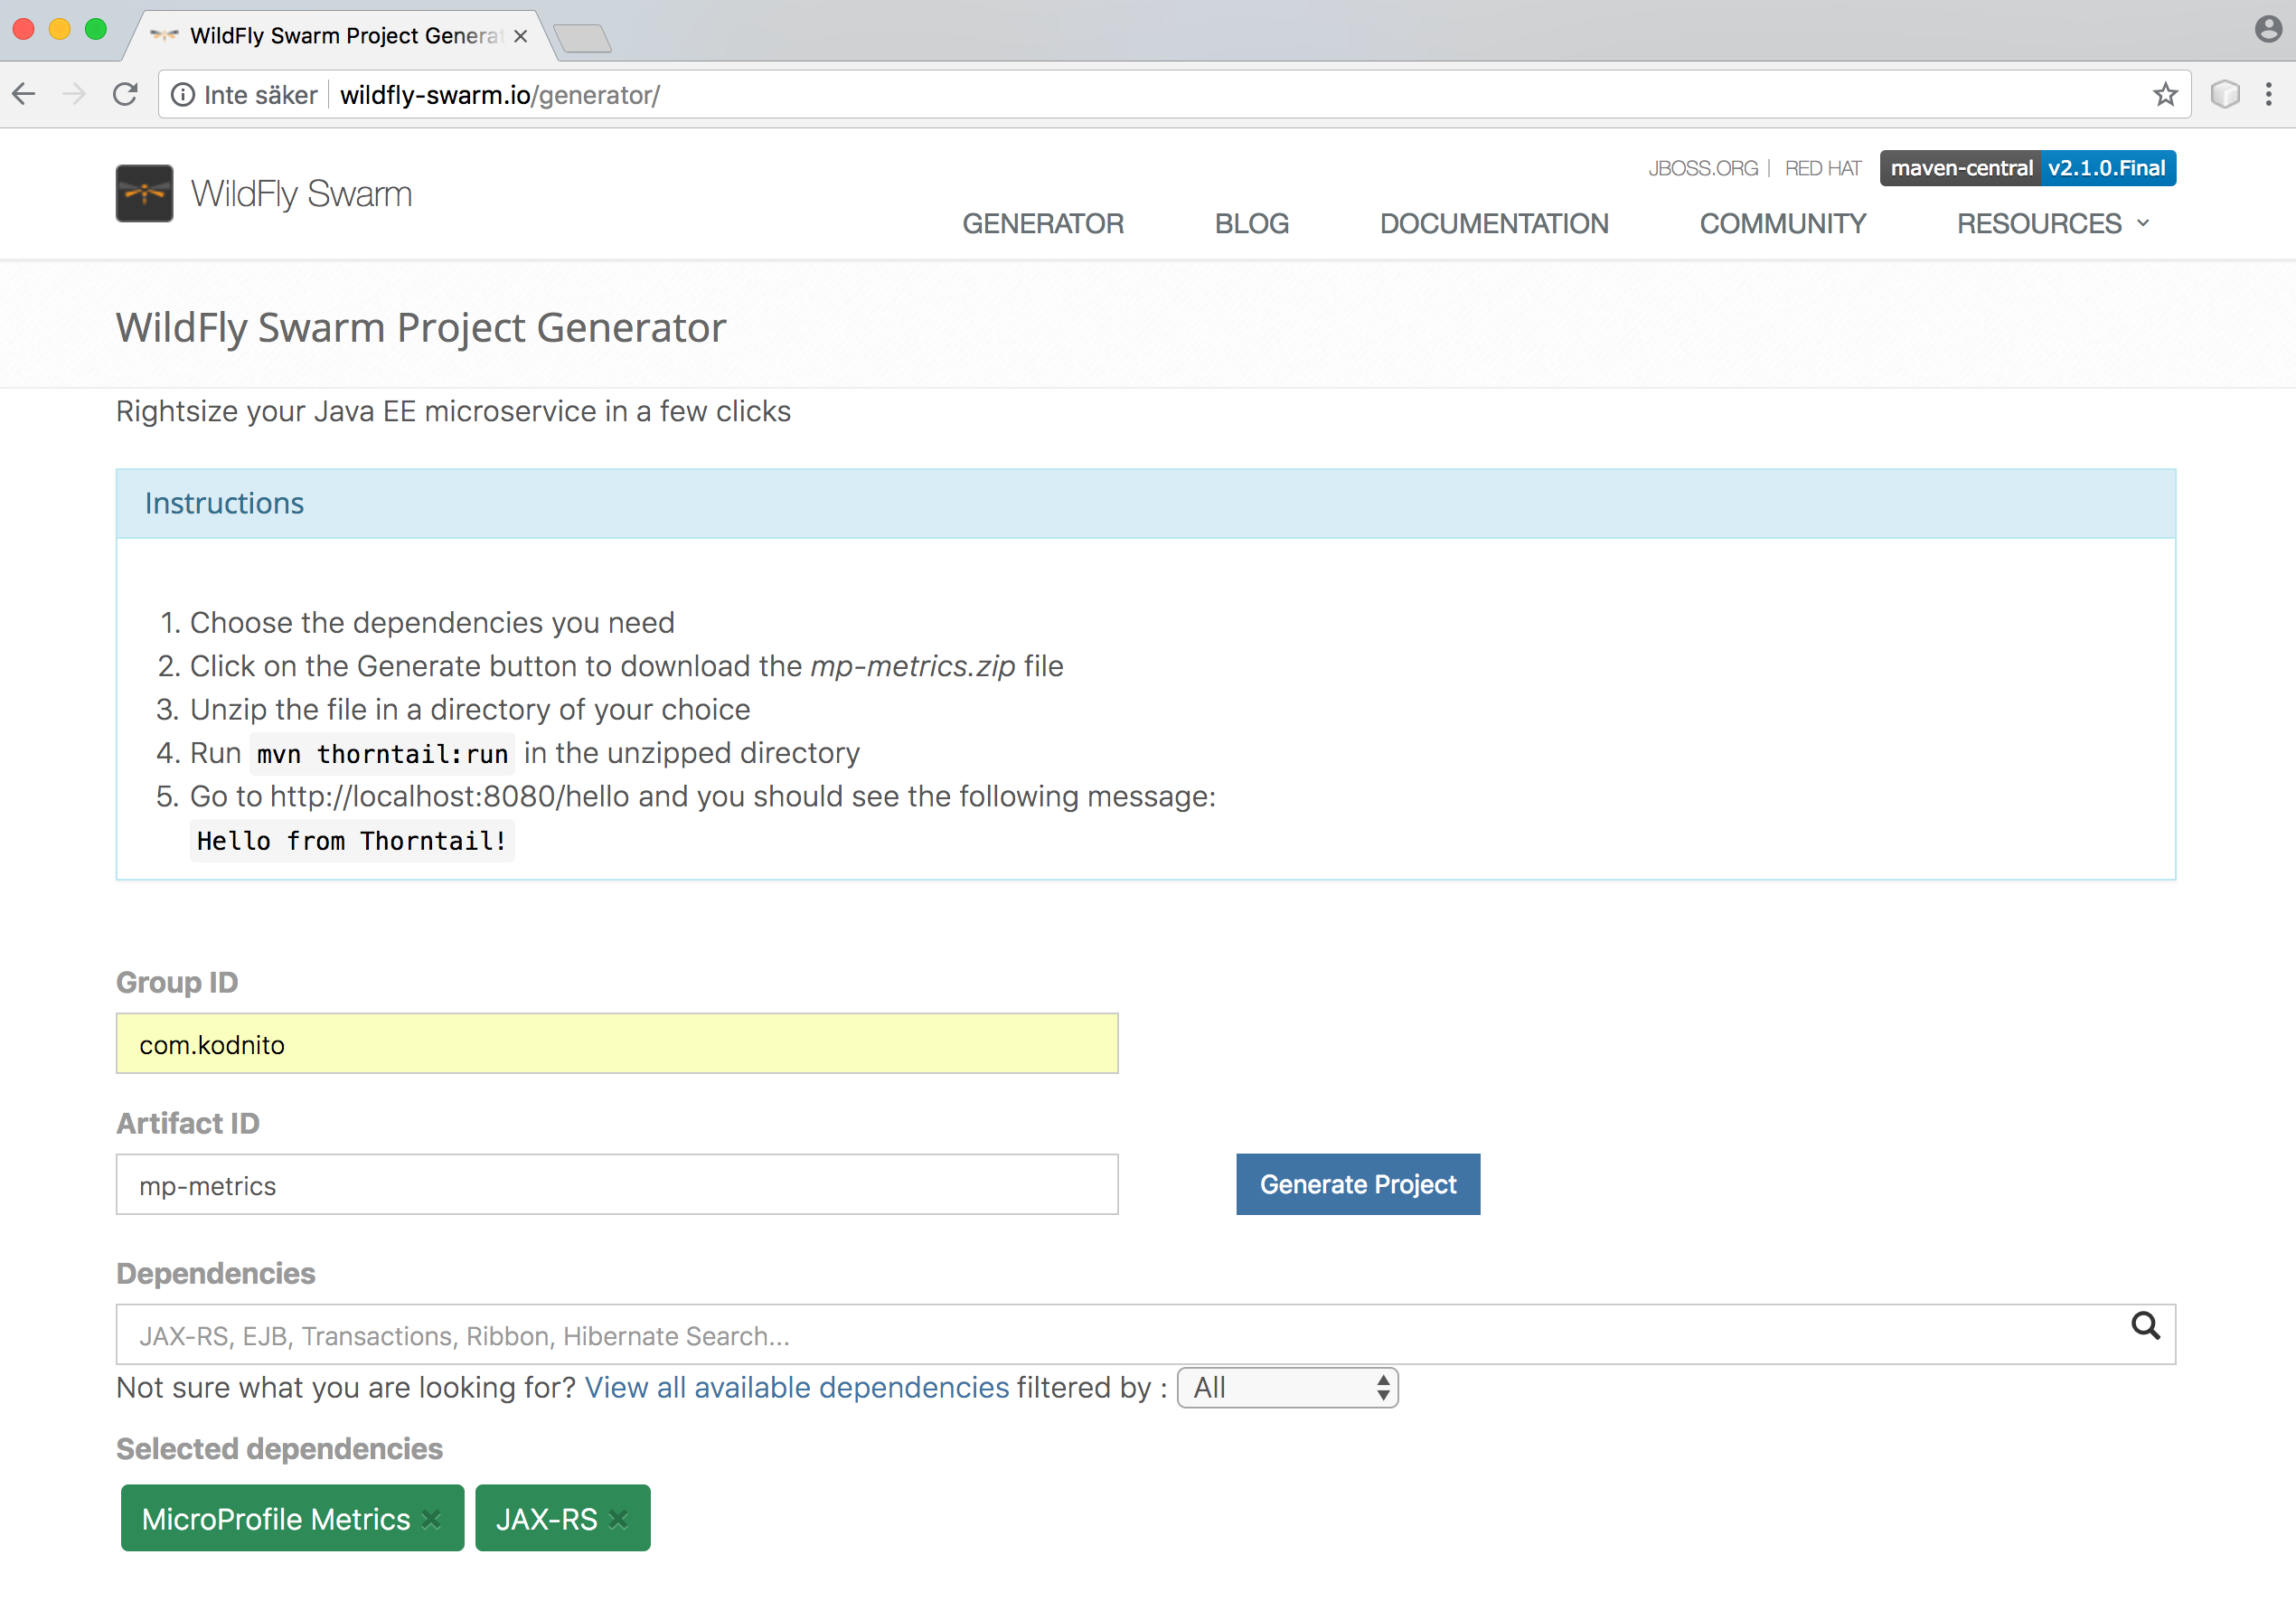
Enter the Details as Follows
Group ID: com.kodnito
Artifact ID: mp-metrics
Dependencies: MicroProfile Metrics, JAX-RS
Click Generate Project to generate and download your project.
Next, Unzip the downloaded zip file and import it into your favorite IDE.
Open HelloWorldEndpoint.java and change it to look like this
package com.kodnito.mpmetrics.rest;

import javax.enterprise.context.ApplicationScoped;
import javax.ws.rs.GET;
import javax.ws.rs.Path;
import javax.ws.rs.core.Response;
import org.eclipse.microprofile.metrics.MetricUnits;
import org.eclipse.microprofile.metrics.annotation.Counted;
import org.eclipse.microprofile.metrics.annotation.Gauge;
import org.eclipse.microprofile.metrics.annotation.Metered;
import org.eclipse.microprofile.metrics.annotation.Timed;

@ApplicationScoped
@Path("/")
public class HelloWorldEndpoint {

    @Timed(name = "helloMessageProcessed",
            description = "Monitor the time helloMessageProcessed Method takes",
            unit = MetricUnits.MILLISECONDS,
            absolute = true)
    @GET
    @Path("/hello-message-processed")
    public Response helloMessageProcessed() {
        return Response.ok().build();
    }

    @Metered(name = "todosGet",
            unit = MetricUnits.MILLISECONDS,
            description = "Monitor the rate events occured",
            absolute = true)
    @GET
    @Path("/todos-get")
    public Response todosGet() {
        return Response.ok().build();
    }

    @Counted(unit = MetricUnits.NONE,
            name = "helloGet",
            absolute = true,
            monotonic = true,
            displayName = "hello get",
            description = "Monitor how many times helloGet method was called")
    @GET
    @Path("/hello-get")
    public Response helloGet() {
        return Response.ok().build();
    }

    @GET
    @Path("/get-int-value")
    @Gauge(unit = MetricUnits.NONE, name = "intValue", absolute = true)
    public int getIntValue() {
        return 3;
    }

}
@Timed annotation is used to monitor how long the process takes.
The metadata fields on @Timed annotation are optional.
unit sets the unit of the metric.
description is used to describe the metric.
absolute is used to determine if the name specified in the name field is the exact name.
@Metered annotation is used to monitor the rate events occured.
The metadata fields on @Metered annotation are optional.
unit sets the unit of the metric.
description is used to describe the metric.
absolute is used to determine if the name specified in the name field is the exact name.
@Counted annotation is used to monitor how many times /hello-get endpoint was called
The metadata fields on @Counted annotation are optional.
unit sets the unit of the metric.
absolute is used to determine if the name specified in the name field is the exact name.
monotonic is set to true, which means the counter increases monotonically.
displayName the display name of the counter.
description is used to describe the metric.
@Gauge annotation is used to return just a value
The metadata fields on @Counted annotation are optional.
unit sets the unit of the metric.
name the name of the gauge.
absolute is used to determine if the name specified in the name field is the exact name.
Inside your project directory run the following command to start the application :
$ mvn package thorntail:run
Navigate to http://localhost:8080/metrics and you have Prometheus ready metrics
You find the application metrics at http://localhost:8080/metrics/application and if you want to see a single application metric then just navigate to /metrics/application/{MetricsName} for example if we want to see todosGet metric then we navigate to http://localhost:8080/metrics/application/todosGet, if you don't see any metrics then you have to visit the /todos-get (http://localhost:8080/todos-get) endpoint first to register the metric.
Download Prometheus
Navigate to https://prometheus.io/download/ and download Prometheus.
open prometheus.yml and add the following after scrape_configs :
# this is the configuration to poll metrics from localhost:8080
- job_name: 'mp-metrics'
  scrape_interval: 15s

  static_configs:
    - targets: ['localhost:8080']
Your prometheus.yml file should look like this :
# my global config
global:
  scrape_interval:     15s # Set the scrape interval to every 15 seconds. Default is every 1 minute.
  evaluation_interval: 15s # Evaluate rules every 15 seconds. The default is every 1 minute.
  # scrape_timeout is set to the global default (10s).

# Alertmanager configuration
alerting:
  alertmanagers:
  - static_configs:
    - targets:
      # - alertmanager:9093

# Load rules once and periodically evaluate them according to the global 'evaluation_interval'.
rule_files:
  # - "first_rules.yml"
  # - "second_rules.yml"

# A scrape configuration containing exactly one endpoint to scrape:
# Here it's Prometheus itself.
scrape_configs:

  # this is the configuration to poll metrics from localhost:8080
  - job_name: 'mp-metrics'
    scrape_interval: 15s

    static_configs:
      - targets: ['localhost:8080']

  # The job name is added as a label `job=` to any timeseries scraped from this config.
  - job_name: 'prometheus'
    static_configs:
    - targets: ['localhost:9090']
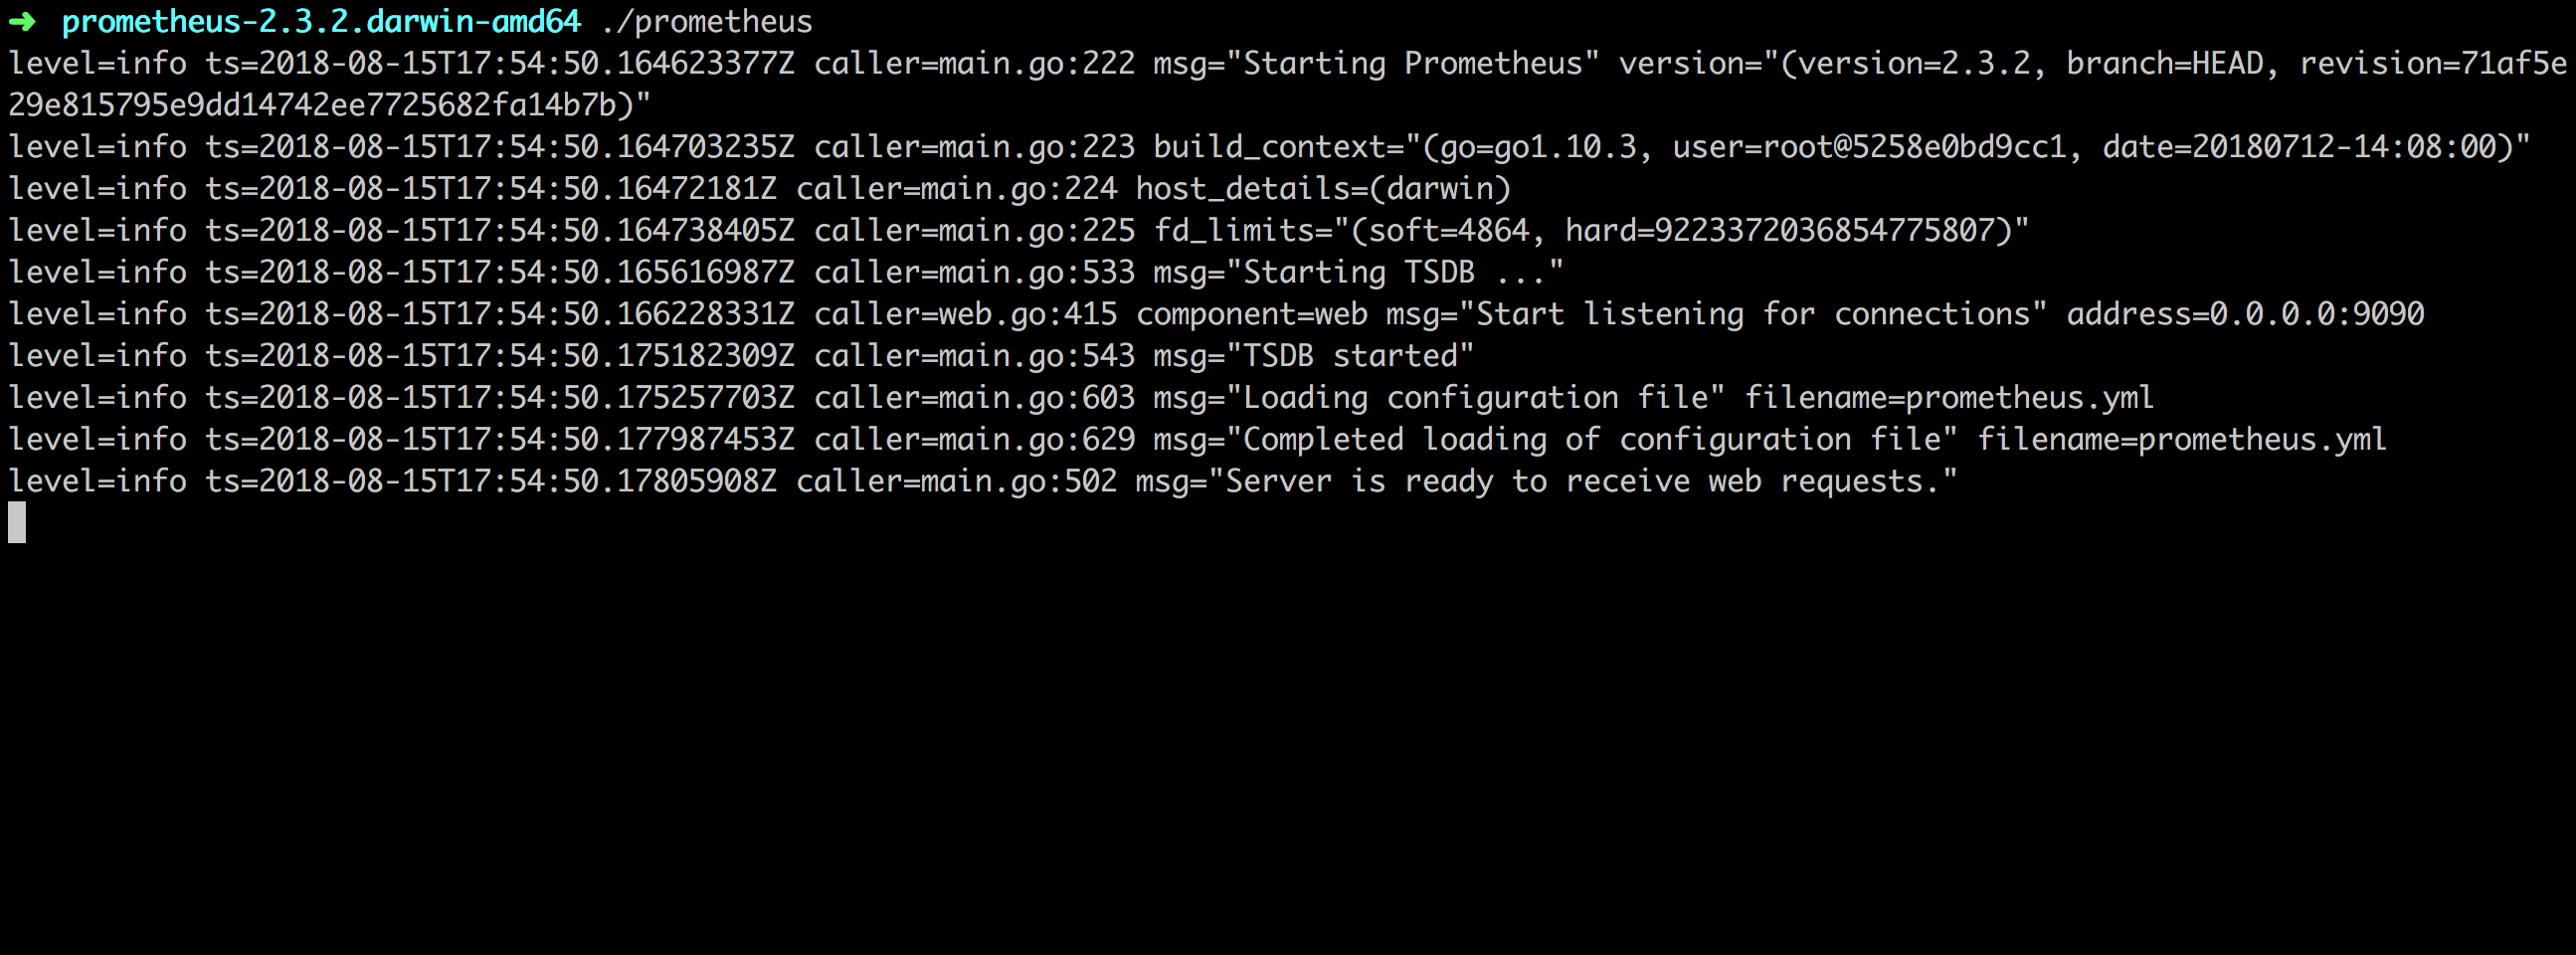
Enter the following command to start Prometheus :
$ ./prometheus
In Status menu click Targets and check that our server is UP: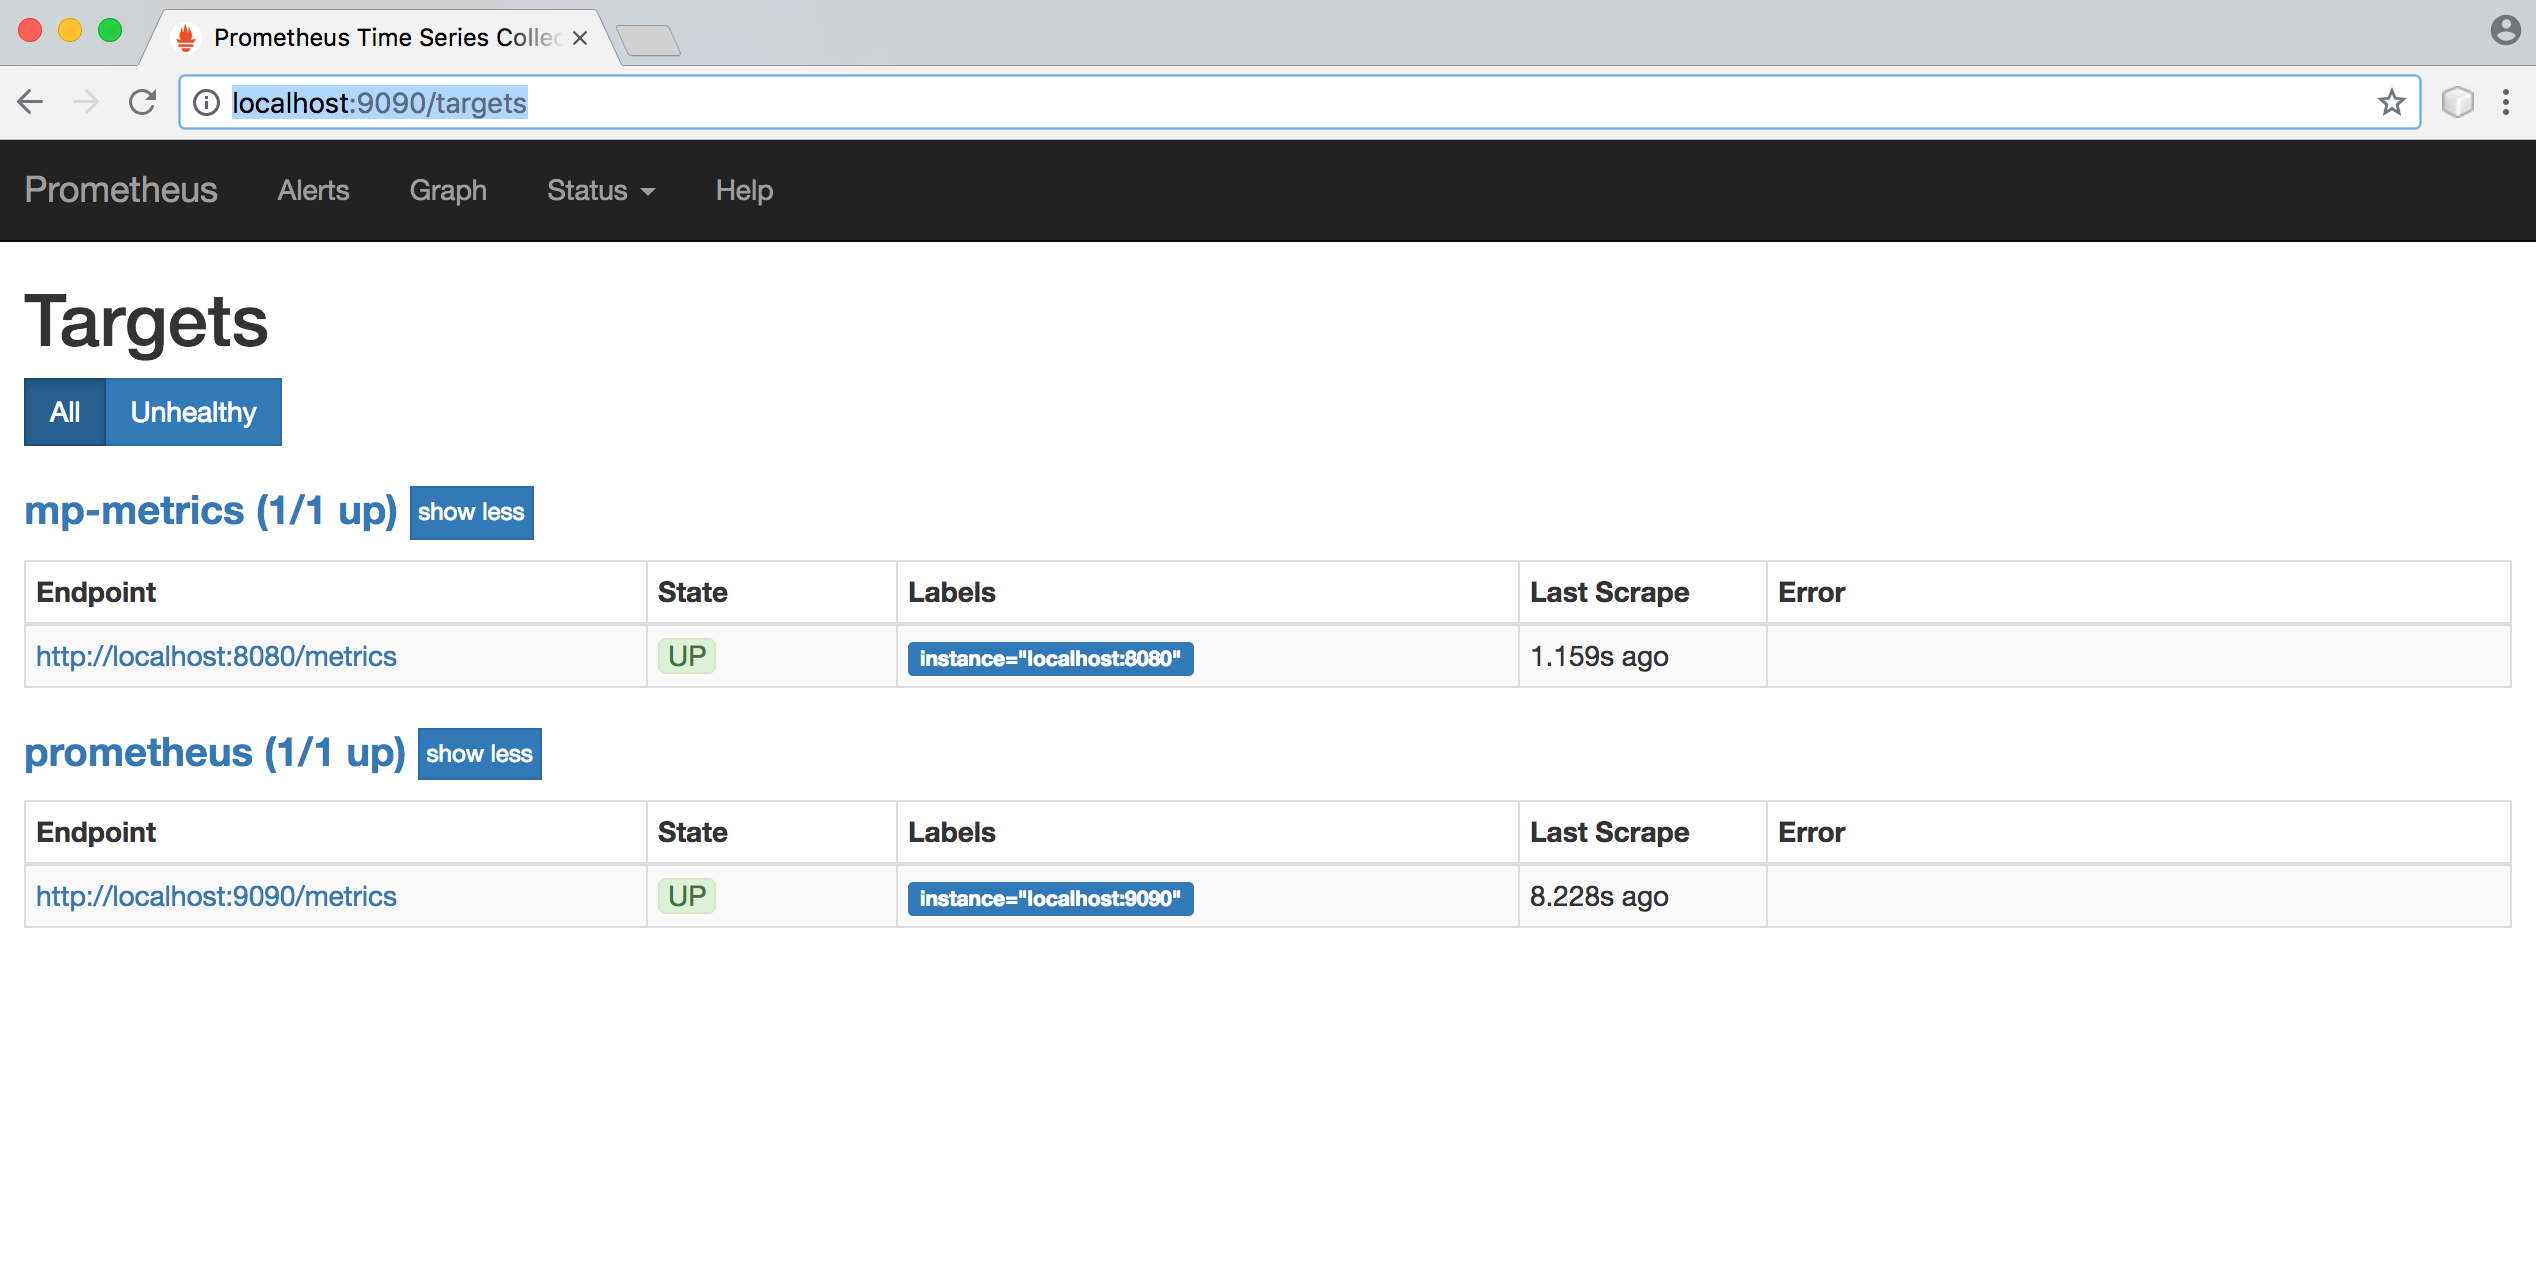
You have all your metrics in the dropdown :
Graphs are nice :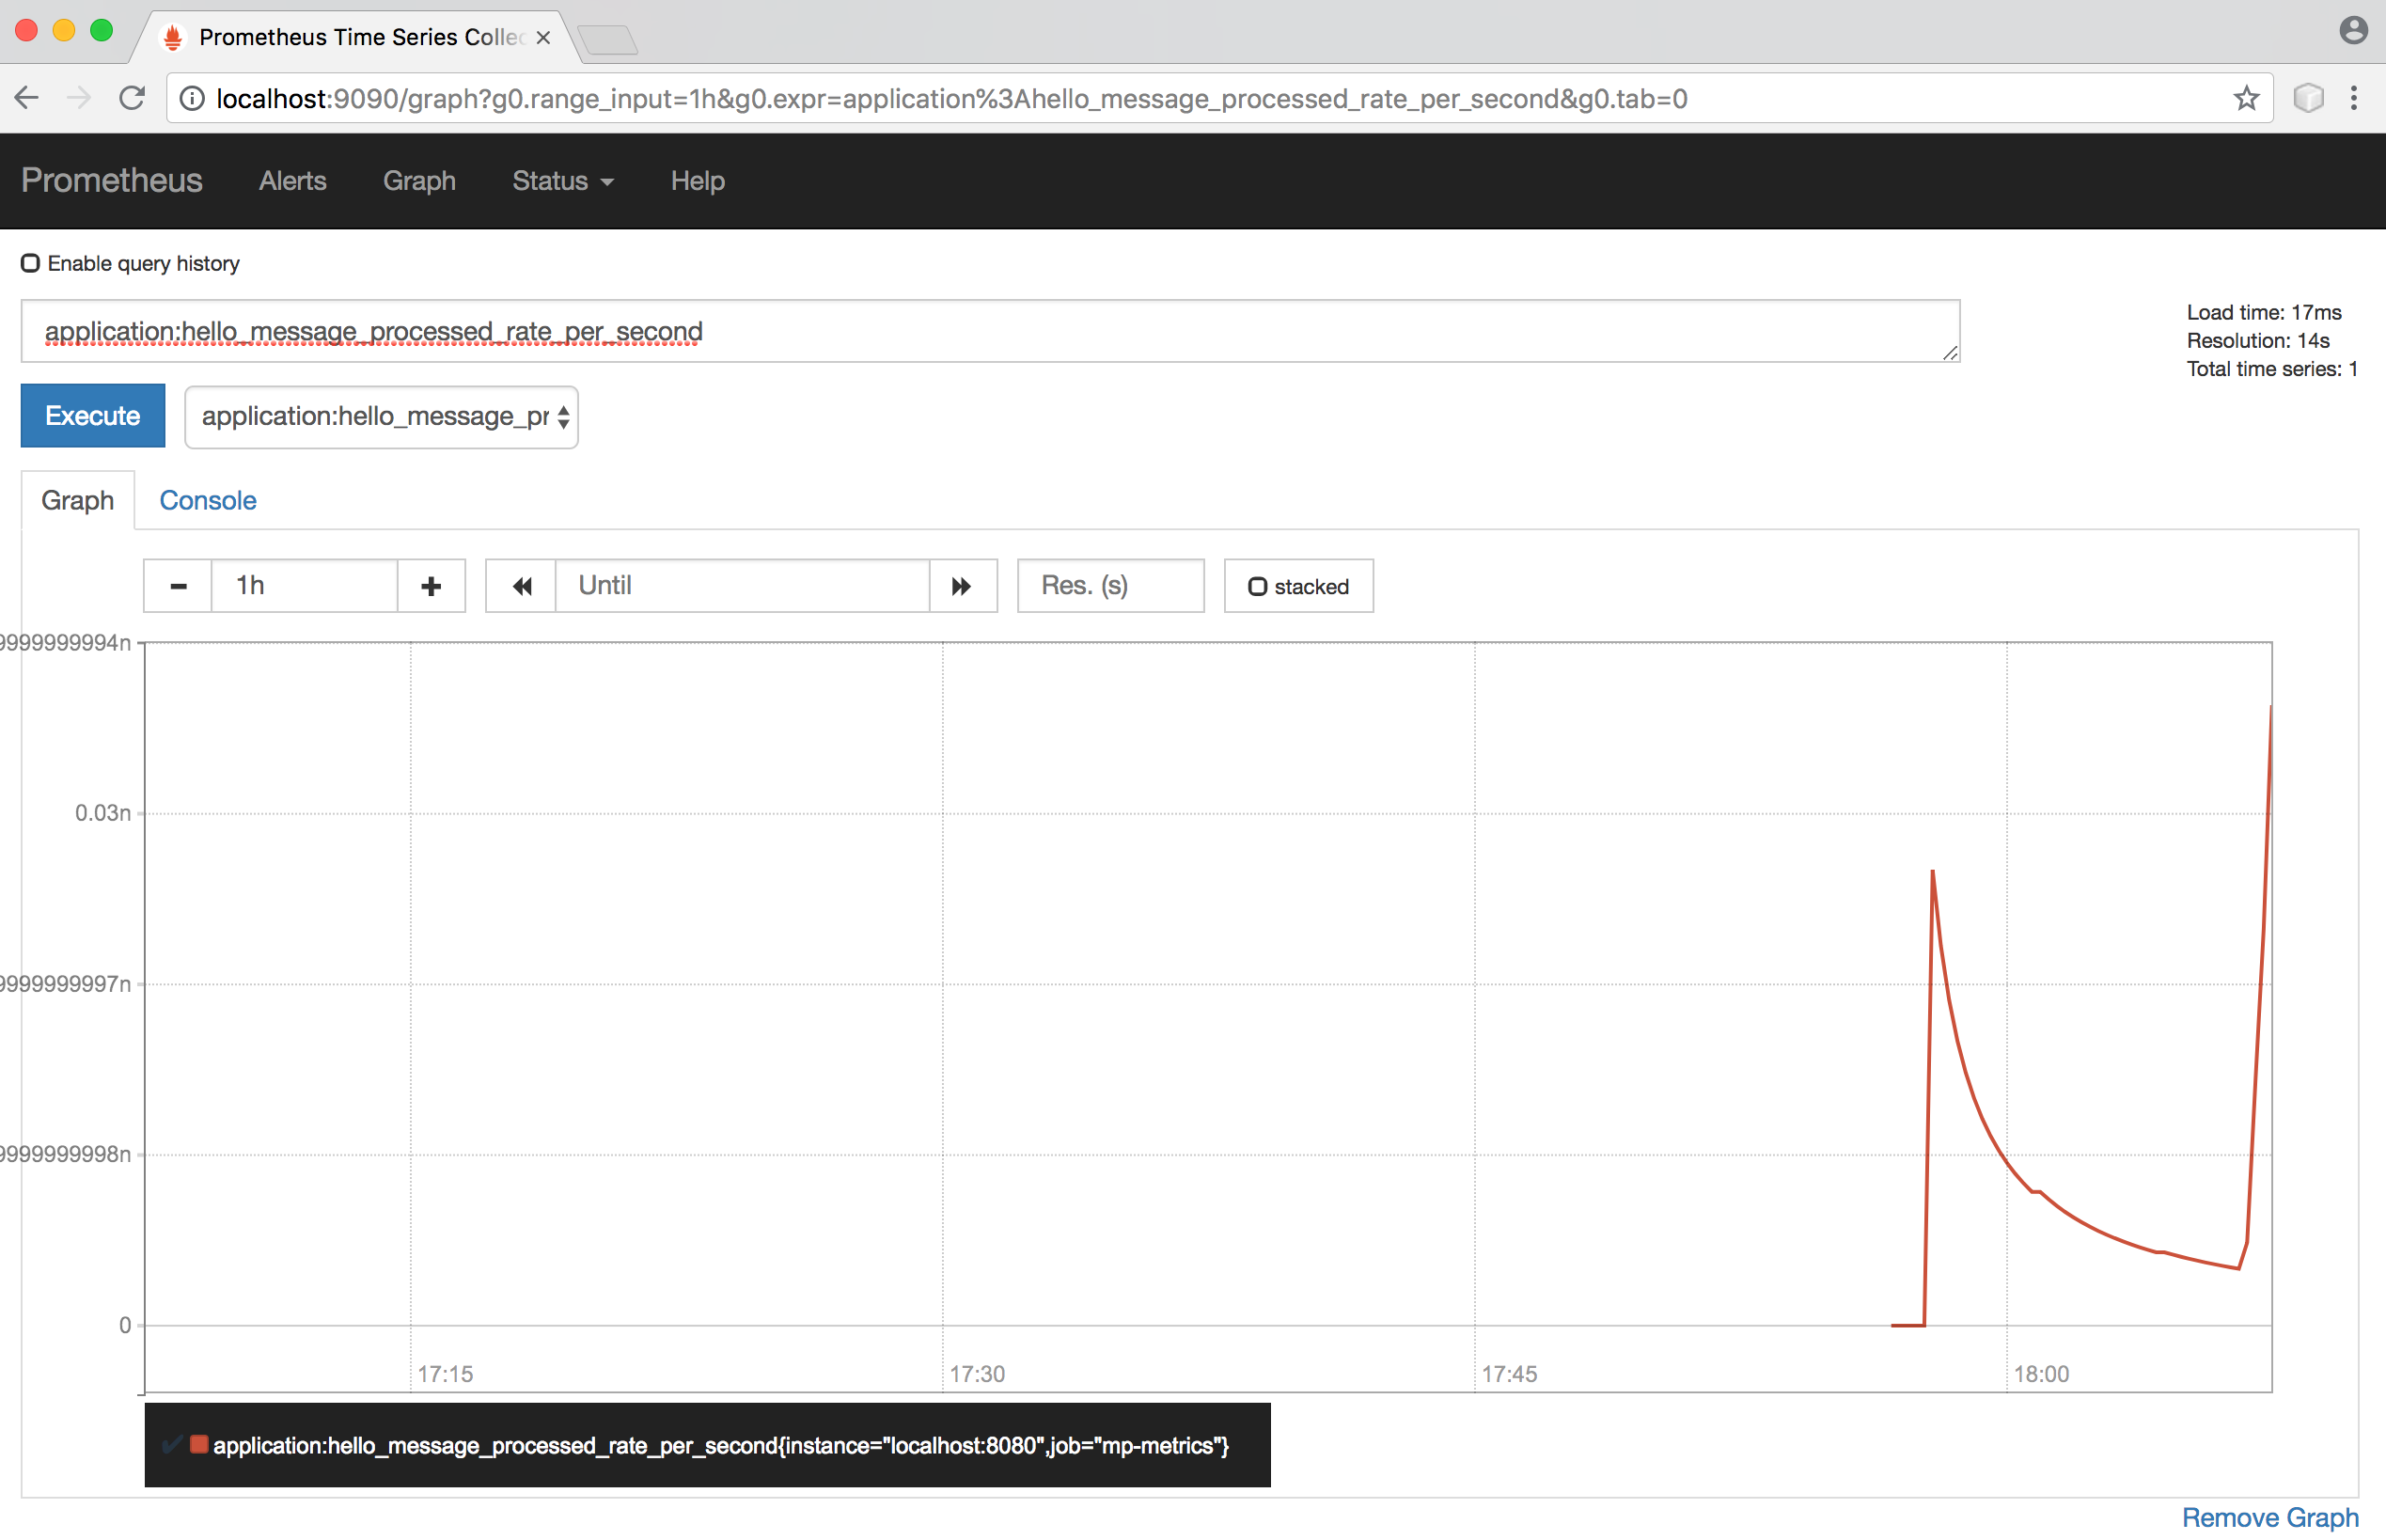
In this tutorial we learned about MicroProfile Metrics and used Prometheus to collect metrics from our application.
Share this: